Populations and Samples
The population is the whole group we want to learn about; a sample is the part we actually observe, and how it is chosen decides what it can tell us.
Prerequisites: Introduction to Statistics.
A population is the entire group of people, objects, or events that a question is about. A sample is the subset of the population that we actually observe. Statistics uses samples because observing a whole population is usually too expensive, too slow, or impossible, and the central problem of statistical inference is how to learn about a population from a sample.
Whether that works depends less on how large the sample is than on how it was chosen. A well-chosen sample of a thousand can tell us more than a badly chosen sample of a million.
Intuition
A cook tasting soup does not drink the whole pot. One spoonful is enough, provided the soup has been stirred. Stirring makes every part of the pot equally likely to end up in the spoon, so the spoonful resembles the pot. If the cook skims only from the top, where the oil collects, no number of spoonfuls will reveal how salty the soup at the bottom is.
Random sampling is the statistician’s way of stirring the pot. It does not guarantee that a particular sample looks exactly like the population, but it guarantees that there is no systematic reason for it to differ, and it lets us calculate how large the accidental differences are likely to be.
Parameters and statistics
A parameter is a number that describes the population. A statistic is a number computed from the sample. Usually a statistic is used to estimate a parameter.
| Quantity | Population (parameter) | Sample (statistic) |
|---|---|---|
| Size | (sometimes infinite) | |
| Mean | ||
| Standard deviation | ||
| Proportion |
Greek letters such as and are conventionally reserved for population quantities, and a “hat” such as marks an estimate. The sample values are written , and the sample mean is
the sum of the observations divided by how many there are.
The important difference is that a parameter is fixed but usually unknown, while a statistic is known but varies from sample to sample. The average height of all adults in a country is a single number at a given moment. The average height in a sample of 100 of them depends on which 100 were picked. How much a statistic varies across possible samples is described by its sampling distribution.
Populations are not always lists of real people. In an experiment that measures the boiling point of a liquid repeatedly, the “population” is the conceptual set of all measurements the procedure could produce. The same ideas apply.
Simple random sampling
A simple random sample of size is one chosen so that every possible group of members of the population is equally likely to be the sample. In practice this means numbering the members of the population and letting a random number generator pick of the numbers, without replacement.
Simple random sampling has two key properties:
- No systematic error. On average over all possible samples, the sample mean equals the population mean. Statistics with this property are called unbiased; see point estimation.
- Calculable random error. Because chance chose the sample, probability tells us how far a statistic is likely to fall from the parameter.
Other random designs exist (stratified sampling, cluster sampling) and are often more practical, but they rely on the same principle: chance, not convenience or choice, decides who is included.
Many methods in this encyclopedia assume the observations are independent and identically distributed (i.i.d.): each one is drawn from the same distribution and does not influence the others. Simple random sampling from a population that is much larger than the sample is very close to this ideal.
Worked example
A tiny population makes the idea of sampling variability concrete. Suppose a population consists of five values:
Step 1: list every simple random sample of size 2. There are of them, each equally likely.
| Sample | {2, 4} | {2, 6} | {2, 8} | {2, 10} | {4, 6} | {4, 8} | {4, 10} | {6, 8} | {6, 10} | {8, 10} |
|---|---|---|---|---|---|---|---|---|---|---|
| 3 | 4 | 5 | 6 | 5 | 6 | 7 | 7 | 8 | 9 |
Step 2: notice how much the statistic varies. Only 2 of the 10 samples give exactly . Depending on luck, the estimate ranges from 3 to 9.
Step 3: average over all samples. The ten sample means add up to 60, so their average is , exactly the population mean. Individual samples miss, but they do not miss systematically in one direction. This is what “unbiased” means.
Sampling bias
Sampling bias occurs when the way a sample is collected makes some members of the population more likely to be included than others, in a way related to what is being measured. The sample then differs from the population systematically, not just by chance. Common forms:
- Selection bias. The sampling method itself excludes or favours part of the population. A phone survey of landline numbers misses people who only have mobile phones.
- Nonresponse bias. The intended sample is fine, but the people who answer differ from those who do not. Busy people return fewer questionnaires; people with strong opinions return more.
- Convenience sampling. Measuring whoever is easiest to reach: students in your own class, visitors to one website, customers who leave reviews. Such samples can be useful for a first look but rarely represent a broader population.
- Voluntary response. People choose whether to take part, as in online polls. Those who care most about the topic are overrepresented.
The figure illustrates selection bias. A population of 300 people records how many hours a day each spends online. A simple random sample gives everyone the same chance of selection. The biased sample is collected by an online survey, which is more likely to reach heavy internet users: here each person’s chance of being reached is roughly proportional to their hours online.
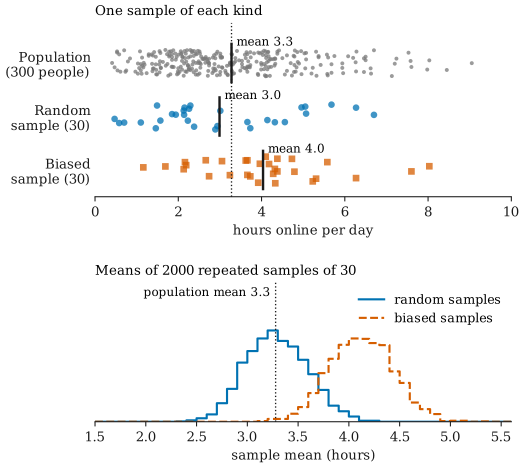
A single random sample can miss too: in the top panel its mean is 3.0, while the population mean is 3.3. The bottom panel shows the difference that matters. Averaged over 2000 repetitions, the random-sample means centre on 3.3 hours, the population mean. The biased-sample means centre on about 4.1 hours, and 99.6% of them are above the population mean. Taking more samples, or larger ones, would not fix this: it would only make the wrong answer more precise.
Sample size versus representativeness
A larger sample reduces random error. The law of large numbers says that, for random samples, the sample mean settles down near the population mean as grows. But a larger sample does nothing for bias, because bias is built into the method of selection.
A famous illustration is the 1936 United States presidential election. The Literary Digest magazine mailed questionnaires to about ten million people, drawn largely from lists such as telephone directories and club memberships, and received about 2.4 million replies. It predicted a clear win for Alf Landon. Franklin Roosevelt won with about 62% of the vote, while the Digest had predicted he would get 43%. The sample was enormous, but both the mailing list and the decision of who replied favoured groups that were less likely to vote for Roosevelt. Freedman, Pisani, and Purves discuss this case in detail.
The lesson: ask first how a sample was chosen, and only then how large it is.
Common misunderstandings
“A bigger sample is always more representative.” Size controls random error, not bias. A small random sample is usually better than a huge biased one.
“Random means haphazard.” Picking people “at random” by walking up to whoever looks approachable is not random sampling; it is convenience sampling with extra steps. Random sampling requires a mechanism, such as a random number generator, that gives every member a known chance of selection.
“A random sample will look like the population.” It will on average, and usually approximately, but any particular random sample can be unusual by chance, as the worked example shows. Inference accounts for this through sampling distributions.
“The sample is the population I care about.” Results describe the population the sample was drawn from. A drug trial run only on adults says little directly about children, however well the adults were sampled.
Further reading
- David Freedman, Robert Pisani, and Roger Purves, Statistics, 4th ed., W. W. Norton, 2007. The part on sample surveys discusses the Literary Digest poll and other examples of sampling bias.
- David M. Diez, Mine Çetinkaya-Rundel, and Christopher D. Barr, OpenIntro Statistics, 4th ed., 2019. Free online; the introductory chapter covers sampling methods and study design.